This is the first set of studies done on my technical
(research) gun. These results are measurements made on the chamber
without a barrel. The barrel port is sealed with a 2" threaded plug.
A drawing and a photo of the chamber are shown below.
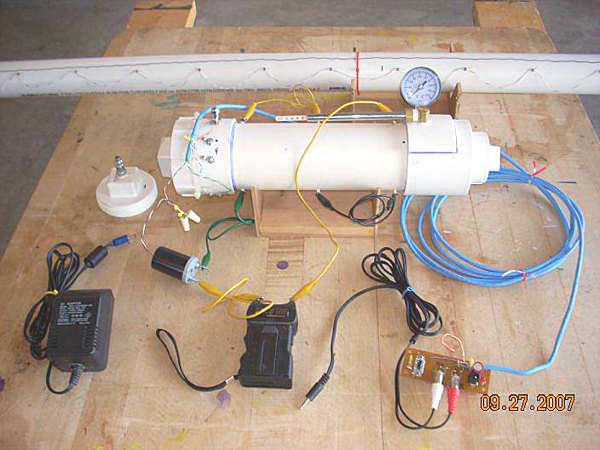
The chamber is constructed of 3" Sch. 40 pressure rated pipe with a
3" cleanout adapter on one end and a 3"-2" reducer, 2" threaded adapter
and 2" threaded plug on the other. There are three spark gaps situated
as shown in the drawing. The spark gaps are connected in series with a
"spark detector" using wires with alligator clips. Any combination of
the three spark gaps can be used. The spark source is a "100KV" stun
gun. Propane is measured with a syringe and injected into the schrader
valve after the stem is removed from the valve. Inside the chamber is a
40mm,
12V brushless CPU fan mounted near the breach end. The chamber is also
equipped with a 200 PSIG dial pressure gauge and a 100 PSIG tire
pressure (TP) gauge. The tire pressure gauge is used as a peak pressure
recording gauge.
The chamber contains a piezo transducer as a pressure sensor. The
output of the piezo is recorded using the sound card of a PC. The
signal created by a "spark detector" is recorded on a separate channel
by
the sound card. The spark detector consists of a neon bulb (Ne-2)
and a phototransistor (PT). When wired in series with the spark gaps
the
neon bulb acts as another spark gap and flashes when the spark gaps
spark. The light output of the neon bulb is detected by a PT placed
next to it. The output of the PT is recorded by the sound card. The
spark detector marks the point
in the recording when the chamber was fired.
The chamber has some leakage problems. When pressurized to ~90 PSIG
with a compressor the leak rate is about 10 PSIG/minute. Most of the
leakage occurs around the piston inside the tire pressure gauge. I have
tried two different TP gauges from different manufacturers and they
both leak around the piston at high pressures. If the TP gauge is
removed and the hole in the chamber plugged, then
the leak rate drops to about 1 PSIG/minute. The studies reported below
were carried out with the TP gauge installed (and therefore the higher
leak rate). Hopefully, at the high speed of the combustion process the
leakage will be insignificant. The pressure drop in 1 second would only
be about 0.17 PSIG.
The TP gauge also seems to have a problem with the very short
duration of the pressure spike. It appears to read high due to the high
velocity that the gauge scale is accelerated to during the firing
process. To offset this I rest my finger on the gauge's scale to add a
bit more friction to the scale as it moves.
For more information about the chamber, sensors and electronics see
my build page.
The firing sequence is;
When fired the closed chamber makes surprising little noise, just a
faint "plunk" sound. The sound of the gauges rattling is almost louder
than the sound of the combustion. The dial pressure gauge spikes to
somewhere near midscale (100 PSIG) and then immediately drops back down
to zero.
A screen shot of the Audacity recording window is shown below. This
firing used the chamber fan and all three spark gaps. The wav file is here.
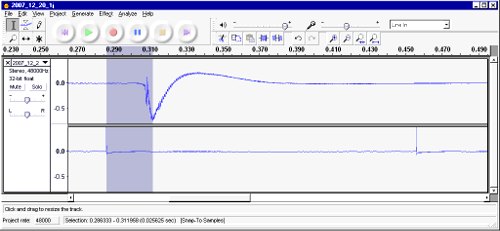
This chamber firing was done with the fan running and all three
chamber spark gaps. The upper trace is the piezo signal and is related
to the pressure in the chamber. The polarity of the piezo signal is
arbitrary, the falling trace is a result of the polarity being reversed
between the piezo and the sound card. With this wiring, a falling
signal represents a rising pressure in the chamber.
The lower trace is the "spark recorder" signal. The highlighted
region starts at the spark that ignited the chamber and ends at the
peak maximum for the piezo signal. The status bar at the bottom of the
Audacity window indicates that this time range was 25.6 mS.
As a first study I examined the piezo "pressure" signal obtained
when the chamber is fired without the fan running and a single
spark gap compared to the signal obtained with the fan running and all
three
spark gaps. A graph of the two piezo traces is shown below.
The above graph was generated by converting the wav files to tab
delimited text files, using Wav2Txt, and then
graphed in Excel. The two traces were aligned by the spark detector
signals so the times
shown are measured from the ignition event for each firing.
As you can see, the peak piezo signal occurs much earlier with the
fan running and three sparks than it does without the fan and only a
single spark. The times to the peak signals were ~25mS for the fan + 3
sparks firing and ~49mS for a single spark and no fan.
I have made a series of measurements with the closed chamber in
which I varied the use of the fan and the number of spark gaps used.
The data is summarized in the table below.
Shot # |
Filename |
Fan
(1) |
Sparks
(2) |
TP Gauge w/Friction (PSIG) |
Peak
Height |
Time
To: (3) |
Relative "Burn Time" (4) |
||||
| Mix |
Fire |
B |
C |
M |
Peak (mSec) |
Zero Crossing (mSec) |
|||||
| 7 |
2007_12_20_1g |
- |
- |
- |
+ |
- |
65 |
0.20 |
48.8 |
67.2 |
1.0 |
| 8 |
2007_12_20_1h | + |
- |
- |
+ |
- |
72 |
0.28 |
38.1 |
53.9 |
0.80 |
| 9 |
2007_12_20_1i | + |
+ |
- |
+ |
- |
90 |
0.44 |
30.1 |
43.3 |
0.64 |
| 10 |
2007_12_20_1j | + |
+ |
+ |
+ |
+ |
>100 |
0.70 |
25.5 |
36.6 |
0.54 |
| 11 |
2007_12_20_1k | + |
- |
+ |
+ |
+ |
90 |
0.45 |
24.8 |
39.4 |
0.59 |
| 12 |
2007_12_20_1l | + |
+ |
+ |
- |
- |
80 |
0.37 |
25.3 |
39.6 |
0.59 |
| 6 |
2007_12_20_1f | + |
+ |
+ |
+ |
+ |
>100 | 0.45 |
25.4 |
37.4 |
0.56 |
Table Notes:
The "TP Gauge w/Friction"
column gives the peak pressure reading obtained with the tire pressure
gauge. The two shots that used both the fan and the full set of
three spark gaps pegged the TP gauge. The theoretical peak pressure for
the combustion of propane in air at 51F is 129PSIG according to GasEq.
There are two data sets that were obtained using the same
conditions.
Shots #6 and 10 were both done with all three sparks and with the
fan running. The timings are very similar for the two shots.
The piezo signal is not directly related to the actual pressure in
the chamber. Piezo transducers produce a voltage that is proportional
to the rate of change of the pressure with respect to time. In
addition, the sound card also modifies the signal since the frequency
is at or below the low end of the audio spectrum. The piezo signal
recordings look like they are approximately the first derivative of the
pressure versus time signal. In the absence of a method to convert the
piezo signal to a true pressure signal we will instead just use the
characteristic shape of the signal to identify a reference time for the
combustion process. We could use the time to the top (actually the
bottom) of the peak as the reference point. In the table above these
values are given in the "Time To: Peak"
column. Since the piezo signal actually looks more like a first
derivative signal I believe that the zero crossing time is probably a
better estimate of when the peak pressure occurred in the chamber. The
zero crossing times are shown in the "Time
To: Zero Crossing" column.
In the graph below the time to zero crossing is scaled by the
slowest burn rate (no fan, one spark).
Graph Notes:
There are several observations that can be made from this data. It appears that;
1. The pressure in the chamber caused by the combustion process lasts for only a very short time. Based on the response of the dial gauge, it looks like the pressure drops back to about atmospheric pressure in less than one second after firing.
2. Thoroughly mixing the fuel results in the fuel burning about 20% faster.
3. Having the fan running during firing increases the burn rate by an additional 15~20%.
4. Three sparks give a small increase (a few percent) in burn rate if the fuel is well mixed.
5. Running the fan during firing and having all three sparks gives another small increase of a few percent.
6. Three sparks and the fan gives an overall decrease in burn time of 40~45% compared to no fan and a single spark.