
The recording was made using the Windows
Sound Recorder. The resulting wav files were displayed using Audio Edit, or
converted to plain
text files and displayed using Excel.
Piezo electric transducers convert mechanical energy into electrical energy and vice versa. This page describes an attempt to use a piezo transducer to record the pressure and sound inside a combustion spud gun chamber. The signal was recorded using the mic input of a laptop PCs sound card.
I installed a RadioShack piezo transducer (similar to this one) in the chamber of a propane fired spud gun. The element, still in its plastic case, was simply epoxied to the inside wall of the chamber and the electrical connections made via a pair of small nuts + bolts passed through the chamber wall.
The piezo element output was passed through a 100 Kohm potentiometer
(which actually reads as 80 Kohm) wired as a voltage divider to
restrict
the voltage applied to the PC sound card. By trial and error I found
that you need about a 1:30 voltage reduction to keep from overloading
the sound cards mic input.
The recording was made using the Windows
Sound Recorder. The resulting wav files were displayed using Audio Edit, or
converted to plain
text files and displayed using Excel.
Below is a graph of the signal from the first shot with the piezo
element in the chamber. My first response was "boy that's more
comlicated than I was expecting!". I wasn't even sure if the signal was
"real".
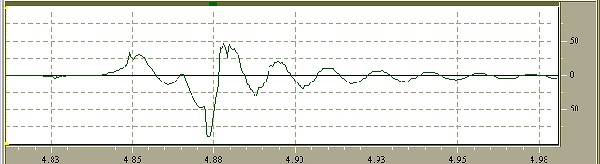
To make sure this signal is reproducible I recorded
another shot. The graph below shows the two recordings superimposed. (I
converted the original wav files to plain text and
superimposed the two curves in Excel.)
The two recordings are nearly identical suggesting that the data is at least reproducable.
Now to try to figure out what all the squiggles mean. Below is the
first recording with several points marked.
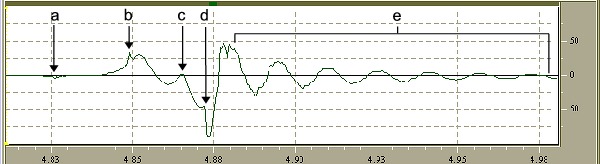
From other recordings with this setup, I know that the signal at "a" is the sound of the piezo trigger. I don't think this is the sound of the spark, but instead the mechanical "click" of the trigger. The piezo recording element is a mediocre microphone and will record any sound.
It is interesting that nothing appears to happen for about 10
milliseconds after the trigger is pulled. There is then a pressure rise
which starts slowly and accelerates.
I believe this peak is the point at which the expanding spherical flamefront has reached the nearest wall of the chamber.
This region is the sound of the "bang", the spud has left the barrel. For this particular gun, this is a 65 Hz signal.
Using my homemade chrono I get 250 fps for similar shots with this
gun.
RadioShack Cat. No. 273-0731 (similar to this one)
~5V and 2~3uA just blowing into the little hole
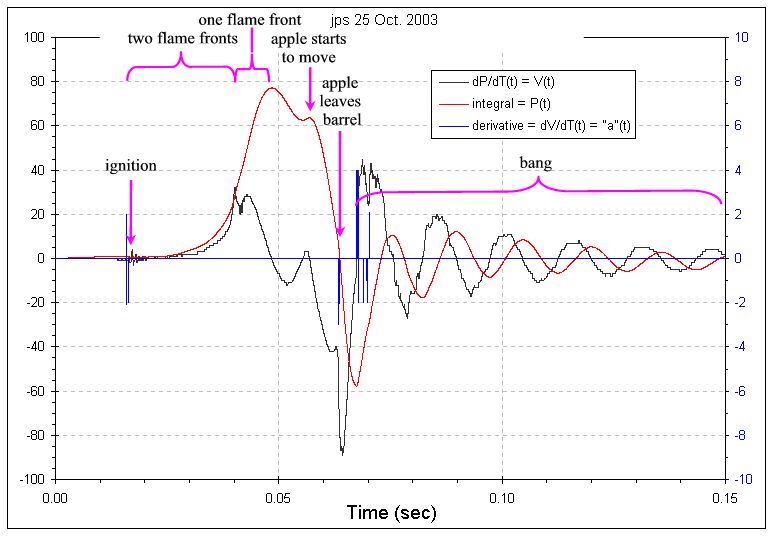
A piezo tranducer produces a voltage at its output that is
proportional to the rate of change of pressure with time.
Mathematically, V ∝ dV/dt. To get the rpessure versus time relationship
from the recording we need to integrate the signal.
Below is
another graph showing both the integral and derivative of the
raw data.
The MIC input on my laptop provides ~2.3 volts (open circuit) at 1
mA (short circuit) on the jack's
tip to power an Electret microphone. I believe the circuit inside the
laptop is similar to the one shown below.
The audio signal from the microphone is sent back along the same
wire
that provides power to the microphone. The signal from the MIC jack is
DC uncoupled and then fed to the analog to digital converter of the
sound card. The DC uncoupling means the MIC input cannot digitize any
DC
component in the signal. For a sound card, the designers probably
called anything below 50Hz or above 20KHz "DC". That means if
the signal goes, for example, positive and stays there for more than
1/50 = 0.02 seconds then the baseline of the recording starts to change
to bring that value back to zero. Looking at the voltage vs. time plot
the voltage goes positive and stays there for about 0.02 seconds, right
in the time domain where the DC uncoupling starts to happen. So I'm
afraid we probably have a drifting baseline confusing the data.
After some research I think I have figured out how to remove the DC filtering that the sound card does to the raw signal generated by the piezo transducer. To remove the DC filtering a correction is calculated for each point in the dataset that represents what the measured value would have been without the DC filtering.
The original recording was 8 bits/sample at 48KHz. The raw data is valued from zero to 255 with 127 representing the zero point. I substracted 127 from each data point to center the signal about zero. For each data point a DC reverse correcction was calculated using;
Vb(i) = Vb(i-1) + Vm(i)*(1-factor)
where;
Vb(i) = DC bias voltage for time i
Vb(i-1) = DV bias voltage for time (i-1)
Vm(i) = The measured voltage at time i
factor = Exp(-dt/RC) = 0.99896 (the time constant DC correction factor)
dt = 1/sample rate = 1/48,000 = 20.8 milliseconds
RC = estimated time constant of the sound card input = 0.02 seconds
(equivalent to 50Hz)
The corrected voltage at time i (Vc(i)) is;
Vc(i) = Vm(i) + Vb(i)
Since the output of the piezo element is actually a recording of dP/dt versus time the signal (Vc(i)) needs to be integrated to get pressure (actually a pseudo pressure since I don't now what the correct calibration factors are). The integrated value, labeled "pseudo pressure", is divided by 500 to put it on the same vertical scale as the raw values.
The graph below shows the raw (Vm), Vbias, Vc and integration
(pseudo pressure).
The graph below shows just the raw (Vm) and integration (pseudo
pressure) traces.
I believe the red curve in the graph above is a reasonable
representation of the pressure versus time curve for this spudgun.
Questions, comments, critiques, flames ... send me an email.
Last Modified: 8 August 2007