Continuing on with interesting things that can be learned with a closed combustion chamber burning propane and air, we will see if it is possible to measure the temperature of the combustion gases as the chamber is fired.
To measure the temperature we will examine the acoustics of the
chamber. An air filled pipe, closed at both ends, resonates at a
predictable
frequency. This resonant frequency is a function of the
length of the pipe, whether or not the ends are closed, and the
temperature of the air in the pipe.
Our data set will be the piezo transducer signal measurement from
the combustion of stoichiometric propane in air in a closed combustion
chamber.
The measurements were made with the chamber fan running and three spark gaps. For more details see my closed chamber page and the build log page.
An air filled pipe closed at both ends resonates at a frequency
given by;
f =
nv / 2L (Eq.
1)
Where;
f
is the frequency
n is an integer (1 = fundamental, >1
for overtones)
v
is the speed of sound
L is the length of the pipe.
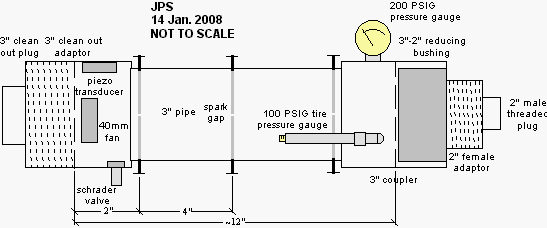
The combustion chamber does not have nice flat ends. Both
ends are
capped with threaded plugs which give complex shapes at the ends of the
pipe. Therefore, instead of attempting to measure the length of the
chamber directly, I smacked the end of the chamber with a hammer and
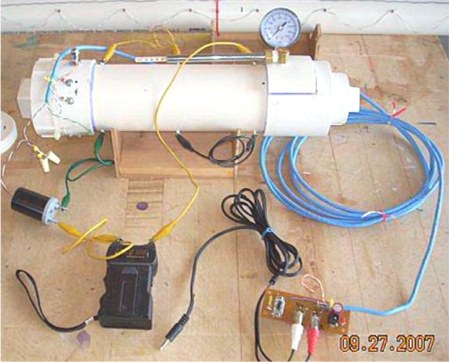
recorded the audio signal produced by the piezo transducer. Below is a
screen shot of the Audacity window showing several smacks. The inlay is
a spectrum analysis of the last smack (the highlighted region). Under
these conditions the chamber resonated at a frequency of 440Hz.
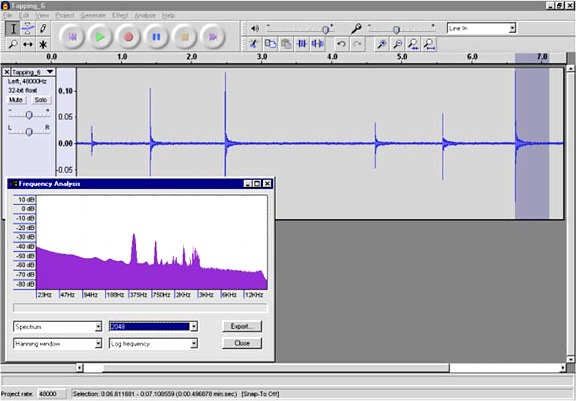
Here is a wav file of the
last tap.
I also pressurized the chamber to ~100 PSIG and recorded the tapping. (The speed of sound is independent of the pressure.) The pressurized chamber resonates at about the same frequency, 450 Hz this time, but with much better tonal quality.
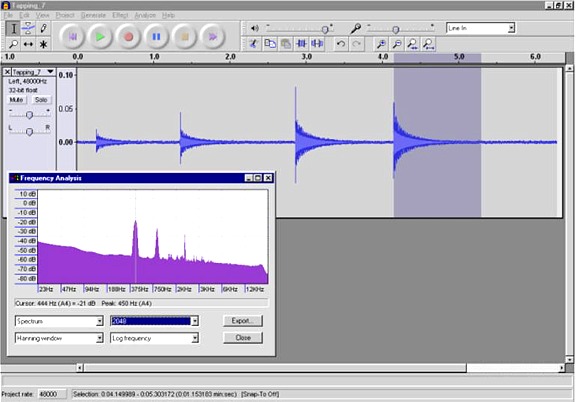
Here is a wav file of the
last tap. The sound recorded by the piezo transducer sounds pretty
good, similar to a bell being rung. Note that the wav file is not what it sounds like to
me as I smack the chamber. To me it just sounds like a hammer striking
a hunk of PVC. Inside the chamber is the only place where the bell like
sound can be heard since there are no openings in the chamber. For the
same reason the chamber makes very little noise when fired, it makes
very little noise on the outside when struck.
The
temperature in my "lab" while doing this was 45F (7.2C). The speed of
sound in air at this temperature was calculated with
the commonly
used equation;
vt
= v0(sqrt(1+ Tc/273.15))
(Eq. 2)
Where;
Tc is the temperature in
degrees celsius
v0 is the speed of
sound in dry air at 0C, 331.4m/s
vt is the speed of
sound at temperature Tc in m/s
Using Tc of 7.2C we get vt = 335.7m/s (1101.5FPS).
Using the resonant frequency of the chamber and the speed of sound
at this temperature,
we can calculate an "acoustic length" for the chamber by solving
equation 1 for L.
L =
nv / 2f
Plugging in v=1101.5FPS, f=450Hz and n=1 gives an
"acoustic length" for the chamber of 1.224 feet (14.7 inch). The actual
overall length of the chamber is 15 inches.
The speed of sound in the combustion products for propane in air was calculated using GasEq. Starting with propane in air at a temperature of 10C (50F) the peak combustion temperature was calculated using GasEq's "Adiabatic T and composition at defined V" calculation. The change in the speed of sound (vsound) in the combustion products was then calculated using GasEq's "Equilibrium at defined T and constant V" calculation as the temperature was lowered in seven steps to 500K (227C). The vsound was plotted versus the celsius temperature (Tc) in Excel and fit with a fourth order polynomial. The resulting equation is;
Tc = (-6.497x10⁻⁸)vsound3 + (6.886x10⁻⁴)vsound2 - (0.9200)vsound + 3076, R2 = 1.000 (Eq 3)
Where;
Tc is the gas temperature in
degrees celsius
vsound is the speed
of sound in FPS.
Equation 3 allows us to calculate the temperature of the gases from
the speed of sound in the gases.
We are now ready to calculate the temperature of the combustion
gases based on the recording of the piezo transducer's signal during
firing of the chamber.
To estimate the temperature in the chamber at various times I took
windows of the piezo recording ten cycles wide and measured the time.
The average
frequency within the window is f = 10/(window
width in seconds). The time at the center of the window was used as the
time for the particular measurement. From the frequency, and the
acoustic length of the chamber, the speed of sound within the chamber
can be calculated with equation 1 after solving for the speed of sound (v);
v
= 2f
L / n
Where the variables are as defined before. n is assumed to be 1, L
is 1.224 feet (the chamber's acoustic length) and f is the frequency measured within
the 10 cycle windows.
v
= (2)(1.224ft)f
v = (2.448ft)f
From the speed of sound in the chamber the temperature of the
gases can be calculated using the GasEq derived values using equation 3.
The graph below shows a region of the piezo transducer recording.
The left side of the graph corresponds to the maximum piezo signal. The
10 cycle boxes are outlined in red. The values for each box are the
observed frequency, the time to the center of the box, the calculated
speed of sound (v) in FPS and
the calculated temperature in degrees Celsius. In the vicinity of the
peak piezo signal the signal is too complex to measure the frequency,
the earliest frequency I could measure was at 32.8mS after ignition,
about 8mS after
the peak piezo signal.
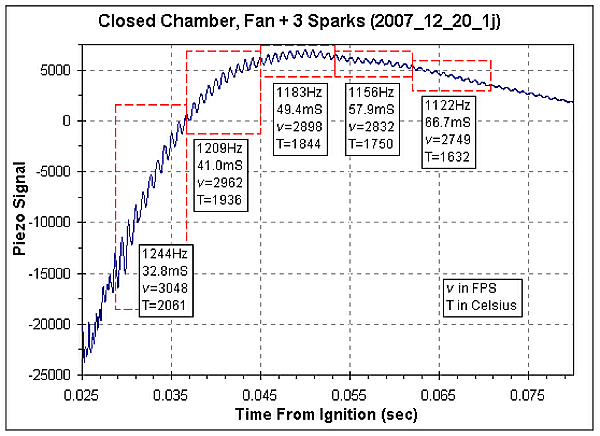
According to GasEq, the peak adiabatic temperature for the
combustion of
propane in air with a starting temperature of 10C is 2358C. The maximum
observed temperature, based on the chamber's acoustics, was 2061C.
Since this value was measured 8mS after the peak piezo signal it
probably is a bit lower than the actual peak temperature in the chamber.
The time versus temperature data from the graph above, along with a
few additional time points, is summarized in the table below.
| Time
From Ignition (mS) |
Time
From Piezo Max (mS) |
Frequency (Hz) |
Speed
of Sound (FPS) |
Temperature (C) |
| 32.8 |
7.8 |
1244 |
3048 |
2061 |
| 41.0 |
16.0 |
1209 |
2962 |
1936 |
| 49.4 |
24.4 |
1183 |
2898 |
1844 |
| 57.9 |
32.9 |
1156 |
2832 |
1750 |
| 66.7 |
41.7 |
1122 |
2749 |
1632 |
| 78.0 |
53.0 |
1113 |
2727 |
1602 |
| 104.2 |
79.2 |
1056 |
2587 |
1412 |
Below is a graph of the calculated temperature versus time from ignition. Extrapolating the temperature to the piezo peak time (marked with the red line) indicates a temperature of 2200C at the time when the piezo signal was maximum.
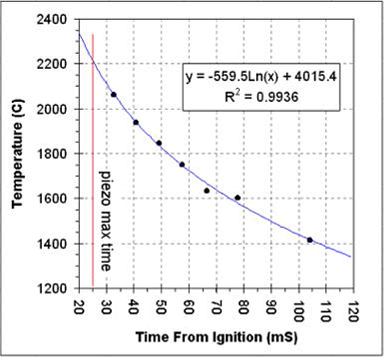
The temperature appears to drop very quickly. For the seven
measurements shown in the table the temperature appears to drop 649C in
just 71 milliseconds. Based on the time and temperature drop we
can estimate a thermal half-life of this chamber of about 110mS. So,
for
every 110mS after the temperature maximum the temperature drops by a
factor of two. For example, at 355mS after ignition (three t1/2's
plus 25mS from ignition to the piezo's maximum signal), the temperature
in the chamber will have dropped by about 88%.
We can use the Ideal Gas Law to relate the temperature in the
chamber to the pressure in the chamber;
PV = nRT
Since the volume (V), number of moles of gas (n) and the gas law
constant (R) are all constants for the closed chamber once combustion
is complete, we can simplify the gas law to;
P = kT
Where k is a proportionality constant. Therefore the pressure in the
chamber is proportional to the temperature in the chamber and the
pressure drops at the same rate as the temperature. So, within a couple
of tenths of seconds after combustion is complete the pressure in the
chamber will have dropped back to near atmospheric pressure.
Since the energy in the chamber is proportional to the
temperature of the gases, the energy in the chamber drops at the same
rate. Within a couple tenths
of
a second after ignition virtually all of the energy in the chamber has
been lost as heat transferred to the chamber walls.
The calculations above were done using the combustion recording
obtained with
the chamber's fan running. To see if the fan makes a significant
difference in
the rate of heat loss I have applied the same analysis to a recording
of the chamber fired with the fan off. The fuel was injected, the fan
was
run for a minute or so, the fan was then turned off and the chamber
left to sit for 5 minutes (to allow the gases to stop moving) and then
fired. For this firing only the central spark gap was used.
The table and graph below gives the acoustically calculated
temperature
versus time plot for this second set of data.
| Time
From Ignition (mS) |
Time
From Piezo Max (mS) |
Frequency (Hz) |
Speed
of Sound (FPS) |
Temperature (C) |
| 43.60 | 4.76 | 1203.4 | 3057 | 2074 |
| 51.75 | 12.92 | 1250.0 | 3175 | 2249 |
| 59.91 | 21.08 | 1203.4 | 3057 | 2074 |
| 68.29 | 29.46 | 1182.0 | 3002 | 1994 |
| 76.80 | 37.97 | 1168.2 | 2967 | 1943 |
| 85.46 | 46.63 | 1142.9 | 2903 | 1850 |
| 94.29 | 55.46 | 1121.1 | 2848 | 1771 |
| 103.37 | 64.54 | 1083.4 | 2752 | 1637 |
| 112.74 | 73.91 | 1051.5 | 2671 | 1525 |
| 130.50 | 91.67 | 1035.2 | 2629 | 1468 |
| 140.21 | 101.38 | 1025.6 | 2605 | 1436 |
| 150.06 | 111.23 | 1004.0 | 2550 | 1362 |
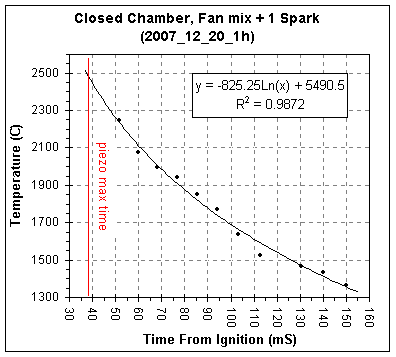
The chamber burns slower without the fan running and with a single
spark, the piezo's
maximum signal occurring 39mSec after ignition versus 25mSec for
combustion with the fan running and three sparks.
The estimated t1/2
for heat loss without the fan running is 114mS, essentially identical
to the 110mS measured for the chamber with the fan running. (For more
information on the closed chamber combustion studies see my Closed Chamber
Studies age.)
To confirm the above results, and to further examine the temperature
and pressure drop I have used a
digital still camera's video mode to record the movement of the
pressure
gauge's needle during firing.
For this chamber firing the tire pressure gauge was removed since
that gauge tends to leak. A leak test of the chamber indicated that the
leak rate was about 1 PSIG per minute at 100 PSIG. The chamber fan was
not running for this firing, though it was used to mix the gases.
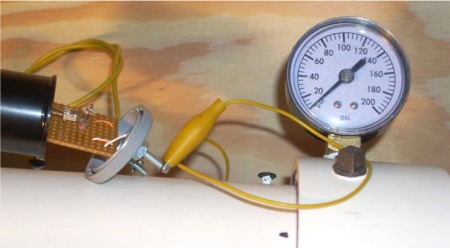
The spark detector was pulled out of it's case (on the left side of
the photo) in the hope that the
video would record the ignition spark. Unfortunately, either the spark
is to
dim, or lasts for too short a time, to be recorded by the camera. The
data recordings for this spark setup give a spark duration is only
about 50 uSec, roughly 1/700th the video frame rate.
The gauge's response was recordable and the movie file is here.
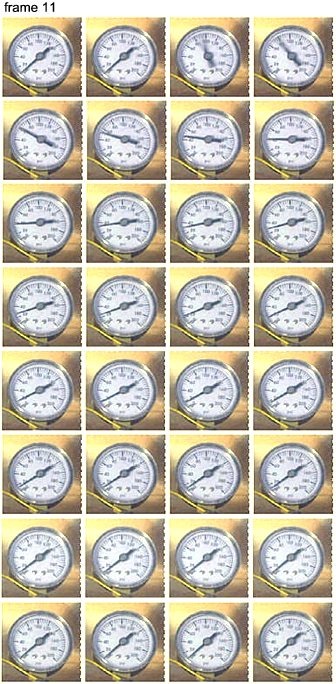
The image below shows 32 video frames recorded during the firing of the
chamber. The camera's nominal frame rate is 30 FPS (one frame every
33.3mSec). In the first two frames the gauge's needle hasn't moved. In
the third frame the needle is a blur in the range of 80 to 100 PSIG. In
the next frame the needle is less blurry and the pressure has already
dropped to about 76 PSIG. Over the next 24 frames (0.8 seconds)
the needle is sharp in the images and drops down to 8 PSIG, which is
the minimum reading of this gauge.
The peak pressure in the chamber is difficult to determine from the
video. The blurred needle in the third frame spans the range of 80 to
100 PSIG. It would seem that the upper end of this range, 100 PSIG,
would be the maximum pressure during the exposure for that frame. Since
the camera's shutter is not open for the entire time length of the
frame it is likely that the actual peak pressure was missed. In
addition, this particular gauge
reads 10~15 PSIG low compared to the regulator gauge on my shop
compressor. It seems likely then that the actual peak pressure in the
chamber is perhaps 10 to 15 PSI greater than what is shown in the video.
Using the video, which is a bit sharper than the still images,
I have estimated the gauge readings as a function of time. The times
and pressures are shown in the table below.
| Frame # |
Time (Sec) |
Gauge Reading (PSIG) |
Frame # |
Time (Sec) |
Gauge Reading (PSIG) |
|
| 1 | 0 | 8 | 17 | 0.533 | 20 | |
| 2 | 0.033 | 8 | 18 | 0.567 | 19 | |
| 3 | 0.067 | 94 | 19 | 0.600 | 17 | |
| 4 | 0.100 | 76 | 20 | 0.633 | 16 | |
| 5 | 0.133 | 62 | 21 | 0.667 | 15 | |
| 6 | 0.167 | 52 | 22 | 0.700 | 14 | |
| 7 | 0.200 | 46 | 23 | 0.733 | 13 | |
| 8 | 0.233 | 41 | 24 | 0.767 | 12 | |
| 9 | 0.267 | 36 | 25 | 0.800 | 11 | |
| 10 | 0.300 | 34 | 26 | 0.833 | 10 | |
| 11 | 0.333 | 32 | 27 | 0.867 | 9 | |
| 12 | 0.367 | 28 | 28 | 0.900 | 8 | |
| 13 | 0.400 | 27 | 29 | 0.933 | 8 | |
| 14 | 0.433 | 25 | 30 | 0.967 | 8 | |
| 15 | 0.467 | 23 | 31 | 1.000 | 8 | |
| 16 | 0.500 | 21 | 32 | 1.033 | 8 |
The graph below shows a plot of this data. The red data points were
not used in the curve fits.
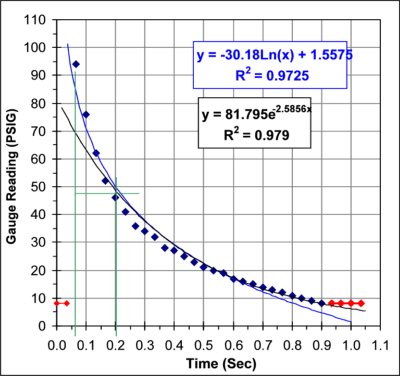
From this data I get a pressure
half-life
of 129mSec. This agrees reasonably well with the 110-114 mSec half-life
obtained from the acoustic studies.
Looking at the graph of the pressure versus time you notice a
systematic trend in the errors between the data points and the curve
fit line. It appears that there may be two processes going on. The
initial rate of heat loss appears to have a half-life of about 130
mSec. As the pressure drops the rate drops as well and towards the end
the rate of heat loss has dropped to a half-life of about 300 mSec. It
is possible that this trend is simply caused by the inability of the
gauge, or the video, to respond quickly enough to the initial high rate
of pressure change. Alternatively, this may represent a real
characteristic of the heat loss in this system.
GasEq indicates that the thermal conductivity of the combustion
gases at the adiabatic flame temperature is 0.15 W/m/K. Air at 25C has
a thermal conductivity of about 0.023 W/m/K. As the gases in the
chamber cool to room temperature the thermal conductivity drops by a
factor of 6.5. It is possible that the systematic trend in the pressure
versus time graph is caused by the increasing insulation properties of
the combustion gases as they cool off. PVC has a thermal conductivity
of about 0.19 W/m/K, similar to the thermal conductivity of the gases
at the adiabatic flame temperature.
Using the thermodynamic properties of PVC and the combustion gases
we can estimate the net temperature rise of the PVC chamber.
The final temperature of the chamber and gases (TF) can
be calculated from;
(Tg - TF)(Cg) = (TF - Tc)(Cc)
TF = (TcCc
+ TgCg)
/ (Cg + Cc) (Eq. 4)
The various values for equation 4 are given in the table below.
| Chamber | Value |
Unit |
Variable |
|
| Starting chamber temperature | = |
10 |
C |
Tc |
| Mass of 12" of 3"ID PVC |
= |
675 |
g |
|
| Estimate of the
mass of the chamber including fittings |
= |
800 |
g |
|
| Specific heat capacity PVC | = |
0.25 |
cal/g/C |
|
| (mass PVC) x (specific
heat capacity PVC) |
= |
200 |
cal/C |
Cc |
| Combustion Gases |
||||
| Starting temperature of gases (GasEq) | = |
2358 |
C |
Tg |
| Volume of chamber |
= |
1.74 |
L |
|
| Density of the combustion products (GasEq) | = |
1.268 |
g/L |
|
| Mass of combustion
products |
= |
2.21 |
g |
|
| Specific heat capacity
combustion products (Cv, GasEq) |
= |
0.285 |
cal/g/C |
|
| (mass gases) x (specific heat capacity gases) | = |
0.63 |
cal/C |
Cg |
| Chamber
to Gases Heat Capacity Ratio |
||||
| (mass
PVC) x (specific heat capacity PVC) -------------------------------------------------------------------- (mass gases) x (specific heat capacity gases) |
= |
318 |
|
So, for every 318°C drop in the gases' temperature the PVC
chamber's temperature rises by just 1°C.
Using the values in the table above and equation 4 we can calculate
the final temperature of the PVC and gases.
| Final
Temperature |
||||
| Final temperature of
gases and PVC |
= |
17.4 |
C |
TF |
| Temperature rise of
the PVC |
= |
7.4 |
C | |
So, even though the combustion gases' peak temperature is more than 2300C (~4200F), the final temperature of the gases and the PVC is only about 7.4C (13F) above the starting temperature.